Published by Miroslav GUTTEN, Daniel KORENCIAK, Peter BRNCAL, Viktor CEFER, University of Zilina, Slovakia
Abstract. The paper deals with the diagnostics of insulation oil-paper in high-voltage transformers by frequency diagnostic spectroscopy. The first part of paper deals with the base information about diagnostics of power transformers. In this part are presented differently insulating methods, for example method of recovery voltage method (RVM), method of polarization and depolarization currents (PDC) and chromatographic analysis. The second part of paper deals use of method of frequency domain spectroscopy (FDS) for high-voltage transformers with insulation oil-paper. This method is used in analysis insulating condition of power transformer with system of oil-paper. It was found, that the results of these tests are highly impacted by the operating temperature during the experimental measurement. Moisture and conductivity between insulating paper and oil in an insulating system are highly dependent from temperature. In the other part, the paper presents experimental results of the frequency diagnostic measurement for a real single-phase high-voltage transformer at different operating temperatures and states (with oil and without). Finally in the last part, the paper presents comparing frequency insulating measurements among several the same single-phase high-voltage transformers.
Streszczenie. W artykule przedstawiono metody diagnostyki izolacji olejowo-papierowej w transformatorach wysokiego napięcia. Zastosowano metodę spektroskopii częstotliwościowej. Wyniki analizy znacząco zależały od temperatury pracy. Porównano wyniki dla różnych warunków pracy kilku transformatorów. Diagnostyka stanu izolacji transformatora wykorzystująca analizę spektralną
Keywords: transformer, frequency diagnostics, insulation, paper, oil
Słowa kluczowe: izolacja transformatora, diagnostyka, analiza spektralna
Introduction
Condition evaluation of insulating the high-voltage oil transformers, particularly of oil conductivity and paper moisture, is becoming more significant for aged power transformers and also for quality control of new equipment in the manufacturing factory. The interest for reliable and easy to use measuring and diagnostic technique drove the development of dielectric time and frequency response methods [1-2].
It is necessary to know condition of transformer insulation between dielectric elements and insulating properties in operating state. The first approach, called recovery voltage method (RVM – Fig.1), is nowadays already known. The newer two methods, polarization and depolarization currents (PDC) and frequency domain spectroscopy (FDS), demonstrated their suitability for diagnostics of transformer and are now frequently used [3].
The advantage of these methods is that it is possible to detect moisture in paper insulation and conductivity in oil of power transformers.
To prevent failure, it is necessary to analyse the chemical processes in insulating oil and paper, as well as their impact on other components of oil transformers too. Chromatographic analysis of gases in insulating oil belongs to the physic-chemical methods using of processes that occur due to negative thermal, electrical or combined phenomena in the failure state of the machine insulation systems, which exhibit by production of gases, known as decomposition gases [4-5].
These types of defects can occur at any time, and because it is an indirect method, allowing detection of gas generated, the challenge is assessed through the composition and quantity of gas, the potential severity of a fault condition of the transformer.
The basic diagnostics of transformers by FDS method
Previous research works in condition diagnostics of dialectical insulation have indicated that the frequency domain spectroscopy can the most effectively estimate deterioration in insulation of oil-paper in power transformer. Since especially the low frequencies (to 0.1 Hz) reflect moisture concentration, their measurement is of outmost importance for reliable data analysis. Beside a frequency sweep, the response of a dielectric to a voltage sweep is experimentally investigated and discussed [9].
Special focus is given on a comparison of the currently available dielectric spectroscopy methods to traditional measurement techniques like dielectric dissipation factor (tgδ) tests at power frequency and 0.1 Hz, dielectric adsorption ratio and the polarization index. The traditional methods suffer from a limited time or frequency range which impedes the discrimination of specific dielectric properties. If for example increased losses appear, it is impossible to discriminate whether they are caused by the insulating oil or the cellulose paper insulation [6].
Applying a sinus frequency sweep in wide range means to measurement the dielectric responses in depending on quality transformer insulate [7].
Dielectric response of the whole insulation system in transformer depends on different factors i.e. on the properties of impregnated paper and pressboard, on the properties of oil, and on the geometrical arrangement of the system components and a correct evaluation of the measured data. In addition information is required about design of insulation system, i.e. the relative amounts of pressboard barriers and spacers in relation to the amount of oil.
For power transformers insulated oil-paper, the dielectric response consists of three components. They are the response of the cellulose insulation (paper, pressboard), the response of the oil and the interfacial polarization effect. Moisture, temperature, insulation geometry, oil conductivity and conductive aging by-products influence the dielectric response [8].
In the Fig.2 is showed the dissipation factor of pressboard having 1 % moisture content and oil together with the interfacial polarization effect (insulation geometry). The frequency range of 1000-10 Hz is dominated by the cellulose insulation, however also the measurement cables and the connection technique influence this region. Oil conductivity causes the steep slope at 1-0.01 Hz. Dissolved conductive aging by-products, soot and high molecular weight acids increase the oil conductivity and thus influence this area. The interfacial polarization (insulation geometry, ratio of oil to pressboard) determines the local maximum or “hump” at 0.003 Hz [9].
The higher the ratio of oil to pressboard, the more dominating is this effect. Finally, the properties of the cellulose appear again at the frequencies below 0.0005 Hz, here reflecting moisture, the manufacturing process and low molecular weight acids. The frequency limits correspond to Fig.2, but will vary in a wide range with moisture, oil conductivity, insulation geometry, temperature and amount of conductive aging by-products. Moisture particularly increases the losses in the low frequency range of the dielectric response of pressboard. Thus, the point of inflexion on the left hand side of the area dominated by insulation geometry is required for a reliable moisture determination [9-10].
Method FDS is mainly used for oil-paper insulation; it can also be used for dry transformers or high-voltage equipment with ferrofluid in magnetic field [7].
Frequency Diagnostics of the Transformer at different conditions
An experimental measurement was conducted on traction single-phase transformer 110/27 kV, which is installed in high-voltage traction substation, for moisture analysis by dielectric spectroscopy. Measurement was conducted at temperature +15°C with transformer oil and – 5°C without oil.
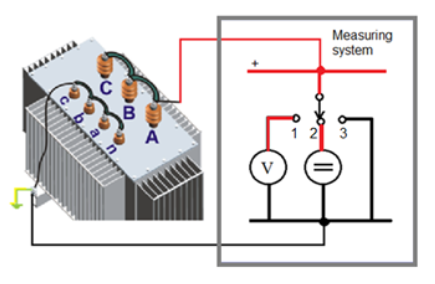
For measuring was used apparatus the MEGGER IDAX350 was used with the connection according to Fig.3, which works on the principle of dielectric spectroscopy (FDS method) by measuring the percentage loss factor, capacities and permittivity depending at the frequency of 1 kHz up to 0.0001 Hz in the sinusoidal power supply 140 Vef.
At the first measurement with oil at +15°C – the total isolation state of the transformer at 20°C / 50 Hz was “good state” according to percentage dissipation factor (%tgδ=0.25) and paper moisture was “good state” (1.95%) by the rating graphs of measuring apparatus 350 IDAX (Fig.4). At the second measurement without oil at -5°C in the comparison – the total isolation state of the transformer at 20°C / 50 Hz was better according to %tgδ=0.22 and paper moisture was better too (1.50%). Capacity of insulating system was significantly smaller (Fig.4), because transformer oil is significant part of whole insulating transformer system.
According to Fig.4 lower temperature causes shift of curve to lower frequencies (direction to the left). This shift was the proof of the theory graph in Fig.2. Other impact was draining oil before the second measurement, because was reduced conductivity of transformer oil for zero (conductivity direction to left according to Fig.2).
Because measurement is performed at very low currents, it is necessary consistently linking all connections according to Fig. 3. Since the device separately distinguishes measurement of individual capacities, it is necessary to thoroughly clean the location for connection of the ground conductor of the device. Poor connection results in errors in current measurements (and then calculated value of percentage loss factor – %tgδ) at frequencies above 200 Hz (Fig. 5).
Comparison of insulating state of the several same transformers
In the part of paper it is described experimental measurement of single-phase oil autotransformers 231/121/10.6 kV, labeled R, S, T, Q, which are installed in power substation. It was used frequency method FDS for analysis paper moisture, conductivity in oil and total state of insulating the autotransformers.
Transformers were disconnected from the power source and measured at the ambient temperature of 16°C. All calculations at 20°C for the loss factor and 25°C for the conductivity of the transformer oil were performed by the instrument MEGGER IDAX-350.
In this method it was measured parameters – the percentage loss factor, capacities and permittivity depending on the frequency of 10 kHz up to 1 mHz in the sinusoidal power supply 140 Vef.
Measured real capacities and dissipation factor in frequency dependence of measured autotransformer 231/121/10.6 kV, designated R, S, T, Q are shown in the Fig.6 and 7.
Evaluation and analysis measurement of the individual autotransformers R, S, T, Q it was performed by apparatus IDAX according to the rating table (Table 1).
The total isolation state at 20°C / 50 Hz was “good state” according to the rating table of the percentage dissipation factor (tgδ %) and analysis of measured curves in the Fig.6 and 7.
Table 1. Basic Analyses by Instrument IDAX-350

Discussion on Measured Data
At comparing these autotransformers according to Table 2, the best (lowest) value of the loss factor tgδ % state was represented by autotransformer R with a value of 0.323%, transformers S and T had approximately the same value of range 0.380-0.381%. Transformer Q showed a slightly higher value loss factor tgδ % = 0.413%.
Table 2. Comparison of values for autotransformers R, S, T, Q
The insulation state (conductivity) of the oil at 25 °C of the R, S, T, Q autotransformers was good according to the oil conductivity table. Temperature at 25°C is standard for investigation and comparison other transformer oils. At compared to these transformers, the best (lowest) value of the relative conductivity of the oil was in autotransformer R (0.43 pS/m). Transformers S, T and Q had oil values from 1.36 to 3.44 pS/m (Table 2).
The moisture of paper in the individual autotransformers R, S, T, Q was different according to the rating table. When comparing all four transformers, the best (lowest) value of the moisture state in the paper showed the transformer R (1.9%), which according to the evaluation table is dry. Autotransformers S and T had approximately the same humidity value (2.3-2.4%), which according to the rating table is slightly humid. The last autotransformer Q had the highest humidity value (3%), which, according to the rating table, is the mild to wet boundary between the conditions.
Based on the above-mentioned analysis of the measured values, it is possible to confirm that in the autotransformer T, which is currently used as a reserve; most of the moisture is deposited in the paper portion of the insulation. This corresponds to an oil conductivity value of 1.36 pS/m.
From the measured values, it is possible for the autotransformer T to estimate that during operation, the conductivity value of the oil would be higher than that of the autotransformers S and Q, which means that before it is put into full operation, it will be necessary to take action to reduce the moisture state of the autotransformer isolation system T.
The analysis further confirms that the oil in the R transformer has undergone total regeneration a year before the measurement. The moisture content and oil conductivity values confirm the excellent state for the power class and the size of the autotransformers to be measured.
A slightly higher oil conductivity value in the S autotransformer may indicate a higher load than the Q transformer. However, the analysis revealed that the moisture content of the Q transformer is highest among the other measured units, but this also means a higher susceptibility to the overcurrent failure (Fig.8).
Conclusion
Experimental measurements have shown a correlation between the measured values and the operational aspects of the individual transformers. It has been shown that the biggest danger for insulation of oil transformers is their shutdown from operation (the highest moisture of paper in transformer Q).
To confirm or disprove the results of spectrum spectroscopy analysis, it would be useful to also analyze the dissolved gas in the oil of the autotransformers measured for the presence of CO2 and CO gases, the amount of which is mainly influenced by the cellulose quality and possible leakage of the autotransformer vessel. Despite the accuracy of the measuring device, it would be useful to compare the loss factors with the higher measuring instrument.
This experimental analysis is determination of new set of diagnostic measured techniques for the analysis of the state of selected type of oil filled power transformers.
We will also connect physical models describing measurable parameters of partial discharge process with the effect of the degradation of insulation state of oil transformer with the increased originality and the innovation and on that basis will be created new integrated system of diagnostics with the possibility of analysis and classification of possible failures on power transformers.
This work was partially supported by the Grant Agency VEGA from the Ministry of Education of Slovak Republic under contract 1/0471/20.
REFERENCES
[1] Kozak C., Sebok M., Kucera, M., The effect of direct voltage polarity on the value of electric arc burning on the W10 switch contacts, 88(2012), Przeglad elektrotechniczny, 96–98.
[2] Brandt M., Identification failure of 3 MVA furnace transformer, DEMISEE 2016, International conference Diagnostic of electrical machines and insulating systems in electrical engineering, Papradno, SR, 2016
[3] Koch M., Krueger M., Puetter M., Advanced Insulation Diagnostic by Dielectric Spectroscopy, Omicron Electronics Austria, 2011
[4] Simko M., Chupac M., Non-destructive method of measurement of radio transmitters antenna systems, Elektronika ir elektrotechnika, 107(2011), No. 1, 33-36
[5] Brandt M., Experimental measurement and analysis of frequency responses SFRA for rotating electrical machines, Elektroenergetika 2017, Stará Lesná, SR 284-288.
[6] Koch M., Tenbohlen S., Krüger M., Kraetge A., A Comparative Test and Consequent Improvements on Dielectric Response Methods, Proceedings of the XVth International Symposium on High Voltage Engineering, ISH, Ljubljana, Slovenia, 2007
[7] Koch M., Reliable Moisture Determination in Power Transformers, PhD thesis, Institute of Energy Transmission and High Voltage Engineering, University of Stuttgart, Sierke Verlag Göttingen, 2008.
[8] Petras J., Kurimsky J., Balogh J., Cimbala R., Dzmura J., Dolnik B., Kolcunova I., Thermally stimulated acoustic energy shift in transformer oil, Acta Acustica United with Acustica, 102(2016), No. 1, 16-22
[9] Koch M., Kruger M., Moisture Determination by Improved On-Site Diagnostics, TechCon Asia Pacific, Sydney 2008.
[10] Neimanis R., On Estimation of Moisture Content in Mass Impregnated Distribution Cables, Stockholm: Royal Institute of Technology Stockholm, 2001, ISSN 1100-1593
Authors: Prof. Miroslav Gutten, PhD.; Assoc. Prof. Daniel Korenciak, PhD; Ing. Peter Brncal; Viktor Cefer; Faculty of Electrical Engineering and Information Technology of the University of Žilina, Department of Measurement and Applied Electrical Engineering, Univerzitná 1, 010 26 Žilina, Slovak Republic, Email:gutten@fel.uniza.sk.
Source & Publisher Item Identifier: PRZEGLĄD ELEKTROTECHNICZNY, ISSN 0033-2097, R. 96 NR 8/2020. doi:10.15199/48.2020.08.09
