Published by Prof. Silviu Darie, PhD (EE), Technical University Cluj Napoca, Romania, Honorary Member of the Romanian Technical Sciences Academy. Email: silviu.darie@enm.utcluj.ro.
Abstract: Based on the author’s experience in designing power systems for critical loads, the paper presents the ways of supplying essential loads, the distribution system layout configuration, the uninterruptible power supply sources (UPS), the UPS modeling and operation, the power system studies by using PTW/SKM professional industrial software.
Key Words: Electrical critical loads, UPS structure and operation, power system modeling procedures, power system studies using professional software.
Abbreviations: UPS – Uninterruptible Power Supply; FDR – Feeder / Cable; CB – Circuit Breaker; FTS – Fast Transfer Switch; PTW/SKM Professional industrial software.
Contributions: A guide for power systems studies with critical loads. Critical loads power system layout; UPS modeling procedures and simulation software settings; power system studies using PTW/SKM professional software.
1. Introduction
The Critical Loads are those to which the power supply has to be maintained under any circumstances and never be interrupted. Such electrical loads are Data Centers, Hospitals, Control Rooms and Control Rooms for Airports, Industrial Control Systems, and oil Shore Platforms. However, there is a need to maintain the power supply to the critical loads during the effective transition to an alternate power supply. The alternate power supply can be the uninterruptible power supply – UPS. The UPS was initially designed for computers. The UPS has a DC battery as an energy storage device. Several UPS are on the market and depend on how they are connected to the critical loads and the UPS configuration [1].
2. System Layout Configuration
Some configurations and structures depend on the size and load profile of the Critical Loads and the application.
One may have the following structure:
• UPS supply from different power sources such as two different Utility Power Supply;
• UPS supply from a Utility Power Supply and a Diesel Generator Set.
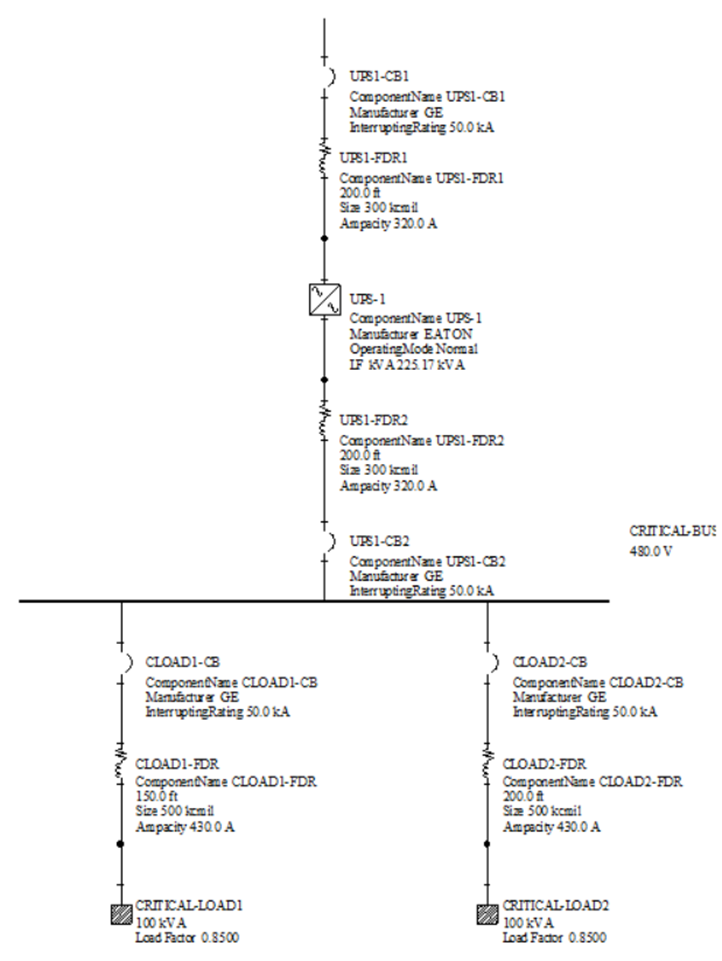
One presents the typical system layout modeling configuration while industrial software is employed: SKM professional software [1].

3. UPS Description
A UPS is a power supply system with energy storage that ensures the load continues to be supplied even if the primary supply voltage fails (EN 50091-1). The UPSs systems protect against data loss and system damage due to power failures, voltage dips, voltage spikes, under voltage, overvoltage, switching, interference voltages, frequency changes, and harmonic distortion.
A. UPS components: The UPS modules/components shall consist of the following main components:
• Rectifier/charger;
• Static inverter;
• Fast Transfer Switch (FTS);
• Output isolation transformer;
• Control panel;
• Monitor panel;
• Communication panel.
B. The main types of UPS
There are three major types of UPS as follows [Eaton]:
• Single-conversion systems;
• Standby UPS;
• Line-interactive UPS
C. UPS Typical Modes of Operation:
The UPS module shall operate online, fully automatically, in the following modes:
Normal Mode: The inverter shall continuously supply the critical load. The rectifier/charger shall derive power from the commercial AC source and shall supply DC power to the inverter while simultaneously float-charging the battery;
Emergency Mode / Battery Operation: When the commercial AC power is outside a –15/+10% window around nominal voltage, the critical load shall continue to be supplied by the inverter, which shall obtain energy from the batteries without any operator intervention. It’s an automatic operation. There shall be no interruption to the critical load upon failure or restoration of the commercial AC source;
Recharge Mode: Upon restoration of the AC source, the rectifier/charger shall recharge the batteries and simultaneously provide power to the inverter. This shall be an automatic function and shall cause no interruption to the critical load;
Bypass Mode: If the UPS module must be removed from the normal mode for overload, load fault, or internal failures, the Fast Transfer Switch (FTS) shall automatically transfer the critical load to the commercial AC power (usually in less than 0.2 seconds). Return from bypass mode to normal mode of operation shall be automatic. Bypass mode shall be capable of being initiated manually without the operation of the static switch from the front control panel.
Generally, a UPS supply system offers uninterrupted power to the AC load by converting DC into AC. UPS differs from an emergency power supply system or a standby generator, as it can protect devices from power outages by one or more connected batteries. The battery run time is relatively short, typically 5 to 15 minutes, but it is long enough to bring the auxiliary power supply online or protect devices from shutting down.
4. UPS modeling for power systems studies
The UPS unit is modeled as two parts: the primary part is connected to the AC power supply, and it is considered as the power system load. The second part is a power source that supplies the critical loads. While PTW/SKM professional software is employed, two UPS pages shall be developed.
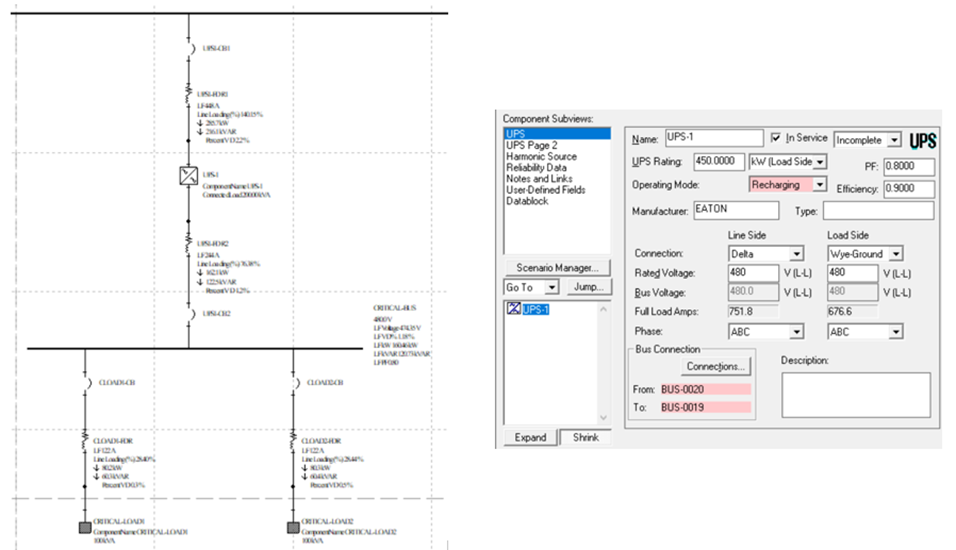
Figure 4.1 The UPS input data is:
• UPS name and manufacturer;
• UPS status: in-service or off;
• UPS ratings on the load side;
• UPS power factor and efficiency;
• UPS connection on the line side and load side;
• Rated voltages on the line side and load side;
• UPS phases.
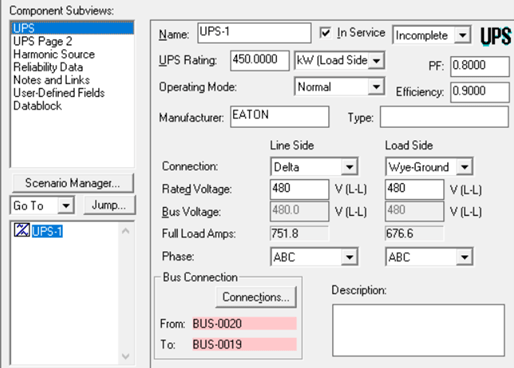
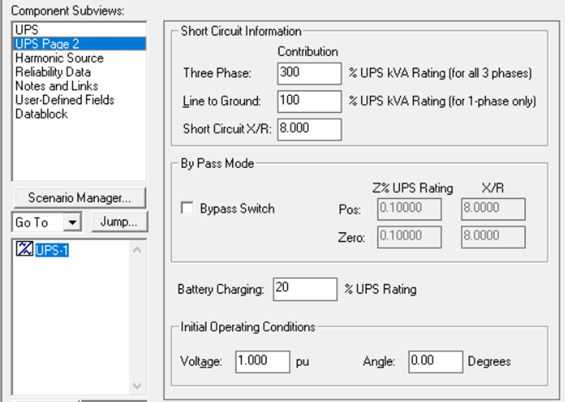
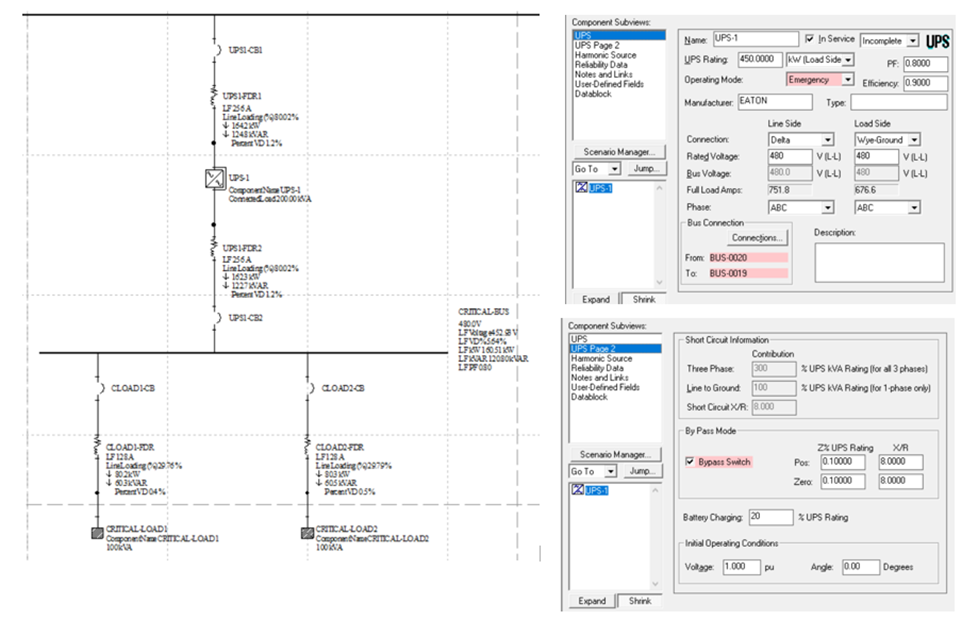
Figure 4.2 The UPS input data shall provide the following:
• UPS short circuit contribution as a percent of the UPS rating;
• Short circuit X/R;
• Battery charging as a percent of the UPS rating;
• Bypass mode provides the technical information for the Fast Transfer Switch (FTS): UPS Zin percent and X/R ratio.
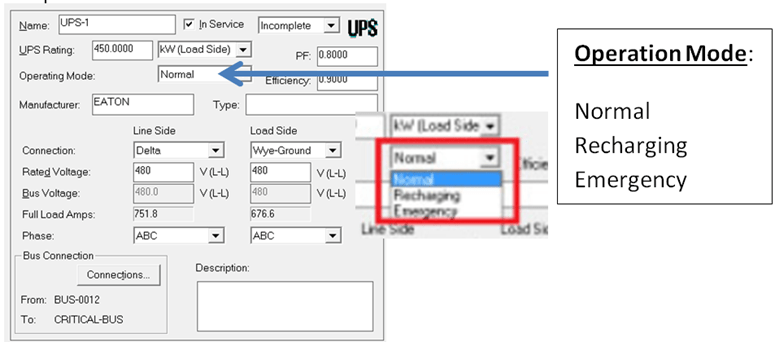
5. UPS operation modes

Note: While UPS is in emergency mode, the FTS is closed in less than 0.2 seconds, consequently protecting the unit.
6. Modeling the Power System with Critical Loads:
The distribution system model shall be developed to be fully integrated and meet the performance specifications requested by the Project Scope of Work.
One recommends that the system model be laid out in multiple drawings/views and in a manner that provides for easy viewing of all analysis results. The one-drawing/view requirement ensures that problem areas found and highlighted by the program are easily seen and not hidden or buried; All one-line symbols shall be adequately spaced to facilitate viewing results on the one-line;
Equipment names used in the modeling software shall be identical to the equipment and naming convention shown on the existing facility drawings and equipment unless conflicts exist; The Consultant Engineer shall discuss facility operation with the designated Facility to determine the possible operating modes of the system and the UPS units. Each system operating mode shall be documented and modeled in the software as “Scenarios” to determine the electrical equipment’s worst-case and associated parameters.
One suggests that the lumped motor groups for MCCs shall be modeled per IEEE standards using groups >50 Hp and <50 Hp. Where motor list data is not available, single lumped groups may be modeled per IEEE-141 “Red Book”;
Medium voltage motors greater than 1.0 kV shall be modeled individually on their respective buses, including all protective phase and ground overcurrent relays and fuses. All substation low voltage power circuit breakers (LVPCB) shall be modeled.
All relay data shall be modeled based on the nameplate data, including manufacturer, type, style, trip device, and settings. Generic substitutions or assumptions shall not be allowed unless data cannot be field verified. All assumptions shall be documented in the report and discussed with the client. All equipment modeling must have a corresponding one-line diagram symbol, meaning there can be no hidden database models. The purpose is for the facility to see all equipment quickly and its associated data, to be able to link documents to the kit as a data repository, etc., and to see problems right on one line. All system modeling shall conform to accept modeling practices as outlined in IEEE-399 “Brown Book.” The Consultant may provide more advanced modeling techniques where compliance with the specification is maintained.
The following guidelines are offered as an aid to determine which technique may be the most appropriate for a particular system operation condition:
7. Power Systems Studies
The power systems simulation generates a TWIN that creates a mirror between a digital model replica and the real world. With all the features integrated into the TWIN, including the requested model date base, one may test power system performance under several conditions.
7.1 Power Flow Analysis
Power Flow / Load Flow is a critical task. The convergence of Power Flow demonstrates that the power system model is feasible and the input data are consistent.
Several methods are employed for Power Flow. The most typical are:
• Seidel Gauss;
• Newton Raphson;
• Fast Decoupled
Some experimentation is recommended to determine the best methods for each power system model.
The following guidelines are proposed as an aid to determining both the UPS modeling layout and the UPS input data:
• Check the critical loads with the designer; if the distribution system already exists, use the SCADA and get the loads as measured data (system as built);
• Pay attention to the UPS mode of operation: Normal, Recharging, Emergency, or By-Pass;
• The By-Pass mode is during a fault at the critical bus;
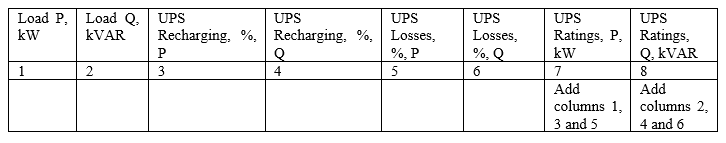
• Pay attention while setting the UPS input data: UPS ratings (P&Q), critical loads P and Q, UPS losses (P&Q); the total load on UPS = critical loads + UPS losses (P&Q) + UPS charging (P&Q);
• UPS input power factor – is not a problem in a modern UPS. The UPS rectifier has reactive and capacitive components, so it will also have a power factor, which must be accounted for when making the upstream electrical connection. The UPS input power factor is a design characteristic usually declared by the manufacturer in the technical specification. With modern IGBT (insulated-gate bipolar transistor) front-end rectifier technology, the input power factor is typically close to unity, 0.99 at 100% nominal load. However, the actual metered input power factor may be slightly different as, for example, highly nonlinear loads can cause the input power factor to decrease slightly. Typically, though, a UPS input power factor will still be in the range of 0.97 – 0.99 and not of great concern. With older technology, using six- or 12-pulse rectifiers, the THDI (total harmonic distortion of current) and power factor require more attention;
• UPS-rated output power factor is a UPS design factor. The rated output power factor describes the maximum active and apparent loading the UPS can tolerate by design. For example, a 100 kVA UPS with a rated output power factor 1.0 can handle loads up to 100 kW active power and 100 kVA apparent power. If the power factor is 0.8, these loads become 80 kW and 100 kV, respectively. The load’s active and prominent power must be known to select and size the UPS correctly. A UPS with a rated power factor of example, 0.8 can handle loads of higher power factor as well – and vice versa;
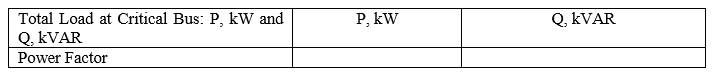
• A load analysis at the UPS output bus is a good approach for determining the total output load (P&Q) and the UPS power factor [1].
7.2 UPS estimated size
Depending on the possible level of damage in case of a data loss/production stoppage, critical applications require exclusively online UPSs, classification following IEC 62040-3 (double conversion UPS).
One has to calculate the possible damage by conducting a risk analysis with the customer. All other aspects, such as low purchase and operating costs (efficiency), are secondary and must take second place to damage avoidance.
However, the author presents the following simple approach [1]:
a. Get the Critical Input Data from the plant engineer:
b. Compute the UPS unit ratings as follows:
7.3 Power Flow Analysis Using Industrial Professional Software:
The power system model is generated using the SKM professional software as an exercise. The model is consistent with the requirements of the IEC and IEEE Standards. The model will also be helpful for future power system model upgrades and improve facility operations. The load flow model should be continuously updated as changes are made to the electrical power distribution system. One, in general, recommends that the facility team using this model keep the load flow model updated as changes are made in the system so it is an “as built” model.
PTW/SKM industrial, professional software is employed for system modeling. The PTW/SKM is a powerful industrial power software for designing and analyzing power systems. It is utilized worldwide by consultant engineers, designers, and utility engineers. The PTW/SKM has been on the market for over 38 years. It has a powerful Graphical User Interface (GUI) with several calculations, an extensive power system database, and intuitive display information. The PTW/SKM is used by over 35,000 engineers worldwide, offering specialized Power Tools design and robust modeling and documentation capabilities. Professional training is provided for PTW/SKM users.
• The load flow shows the bus voltages at all buses and the power flows in all branches: power transformers and lines. The results may be provided as text output results or may be given in the model drawings as Power Flow visualization;
• The convergence of the Power Flow demonstrates that the system is feasible and the system input data is consistent.
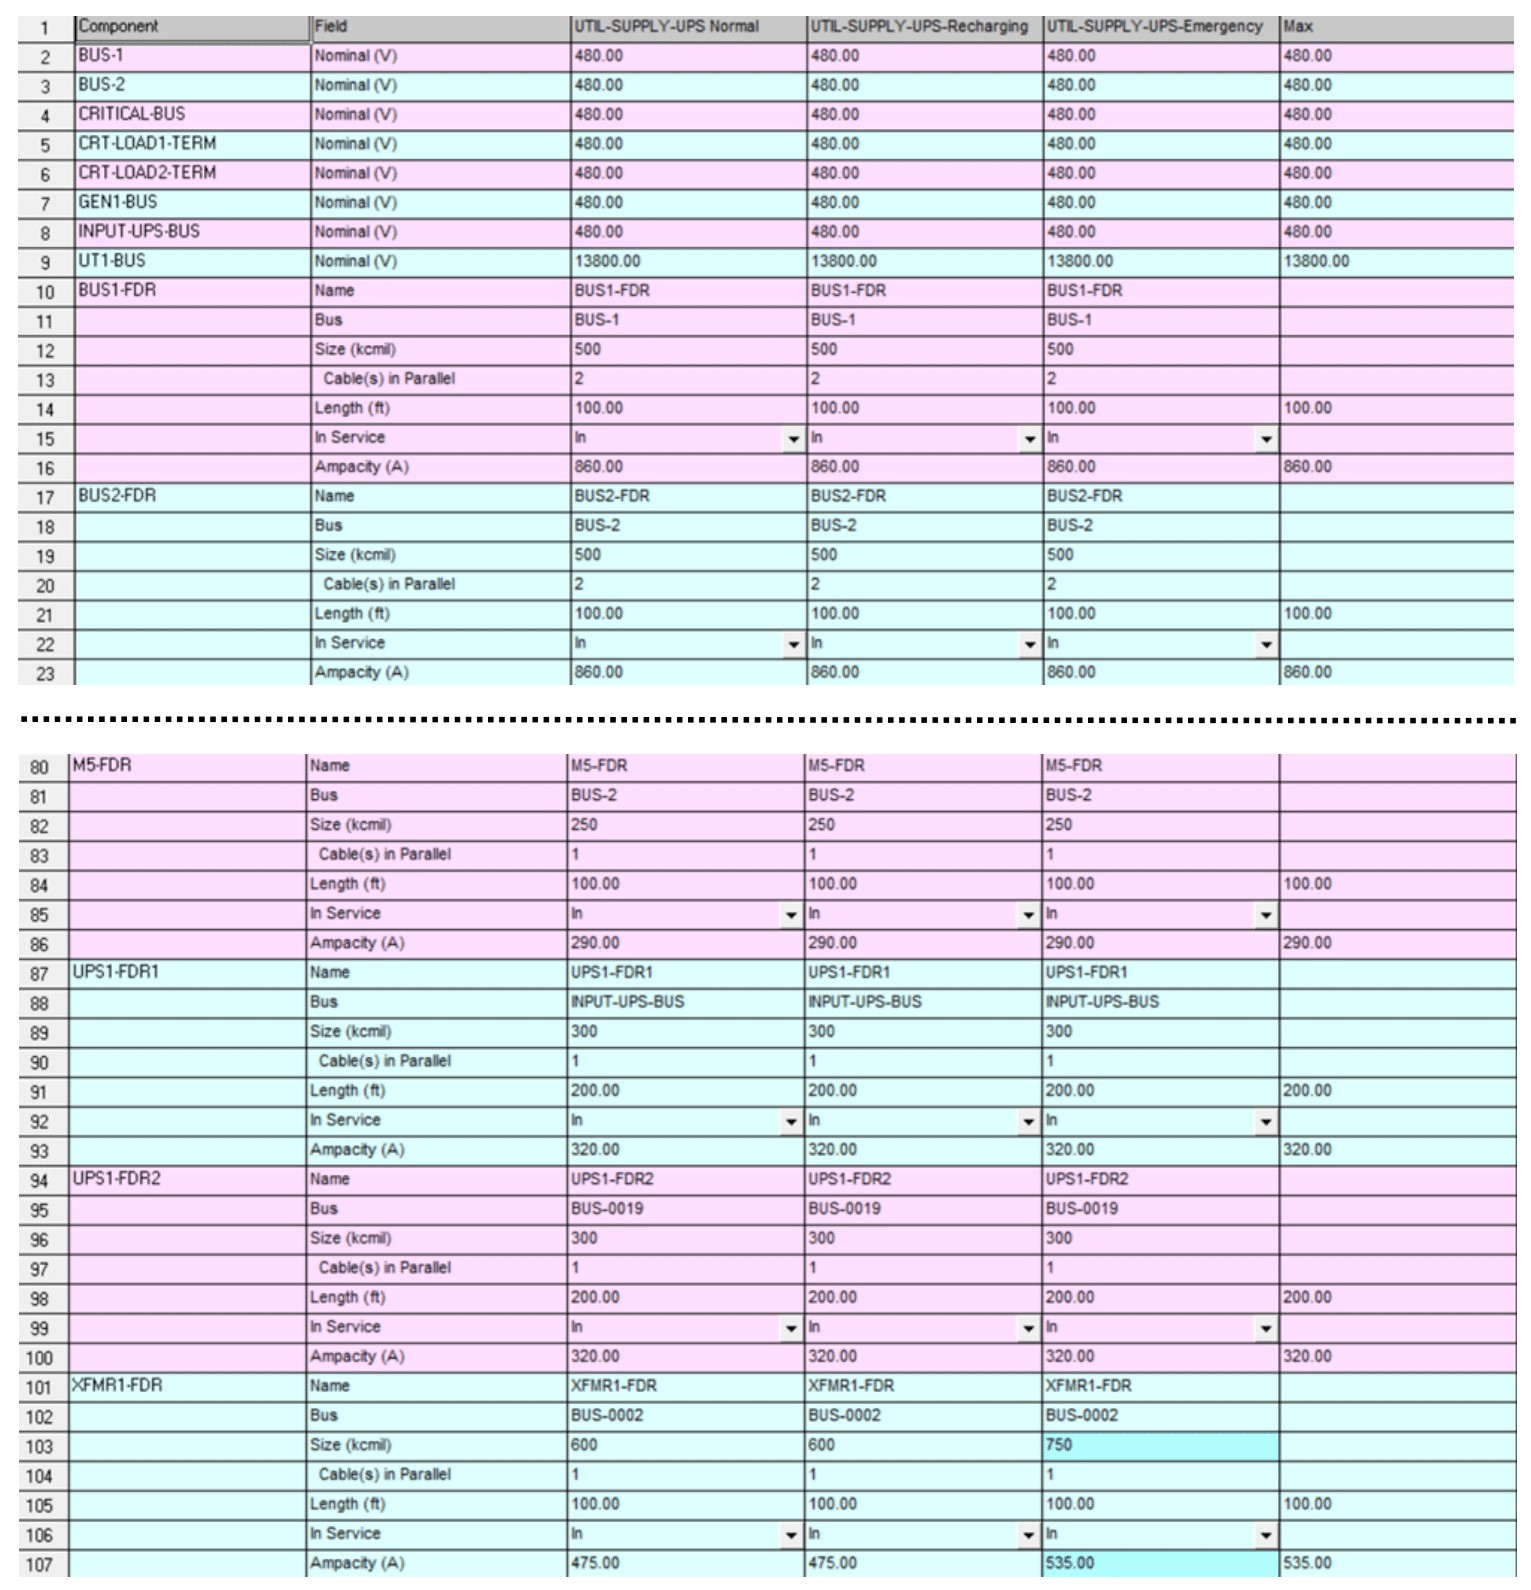
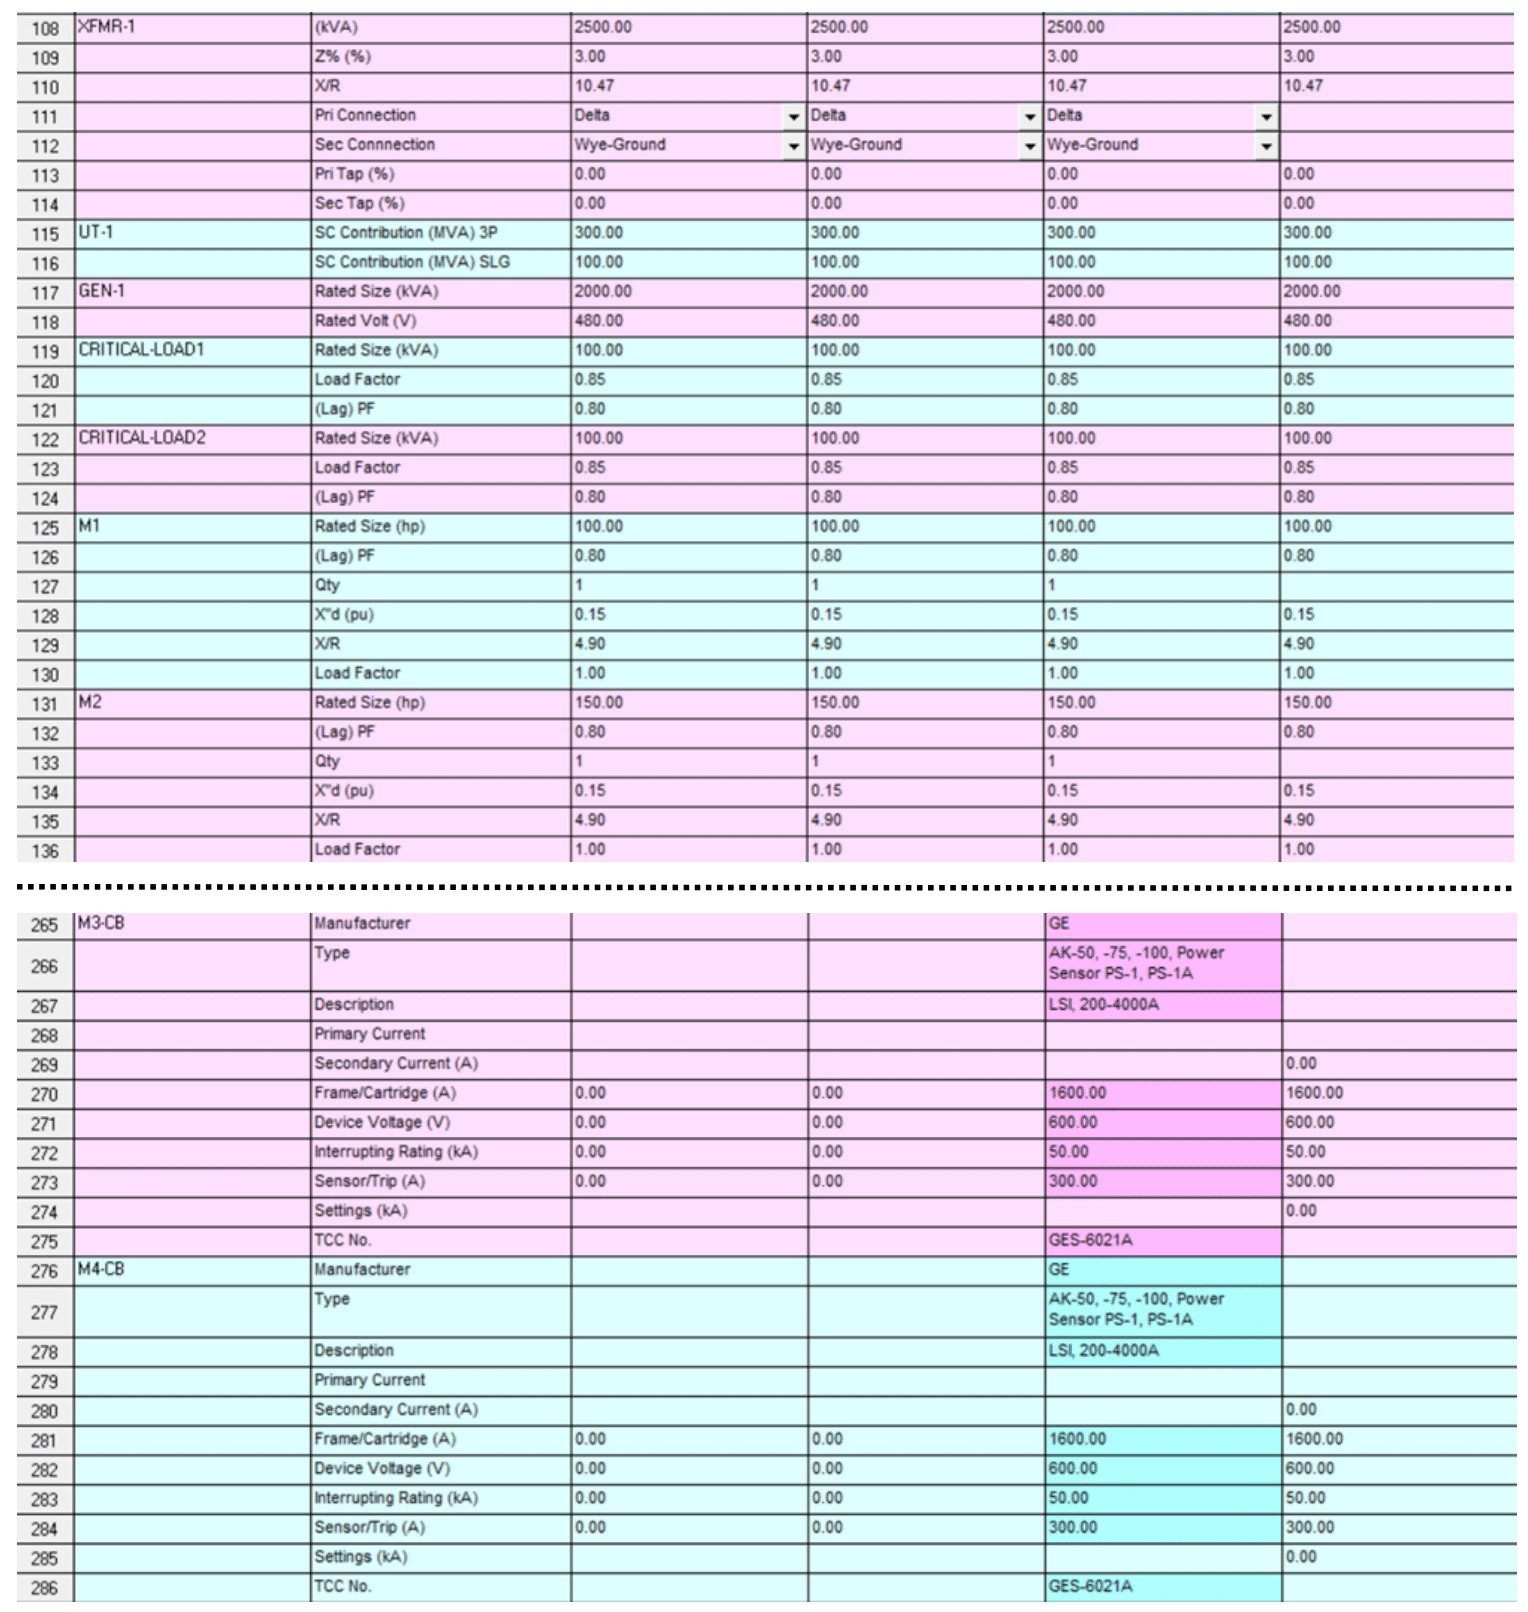
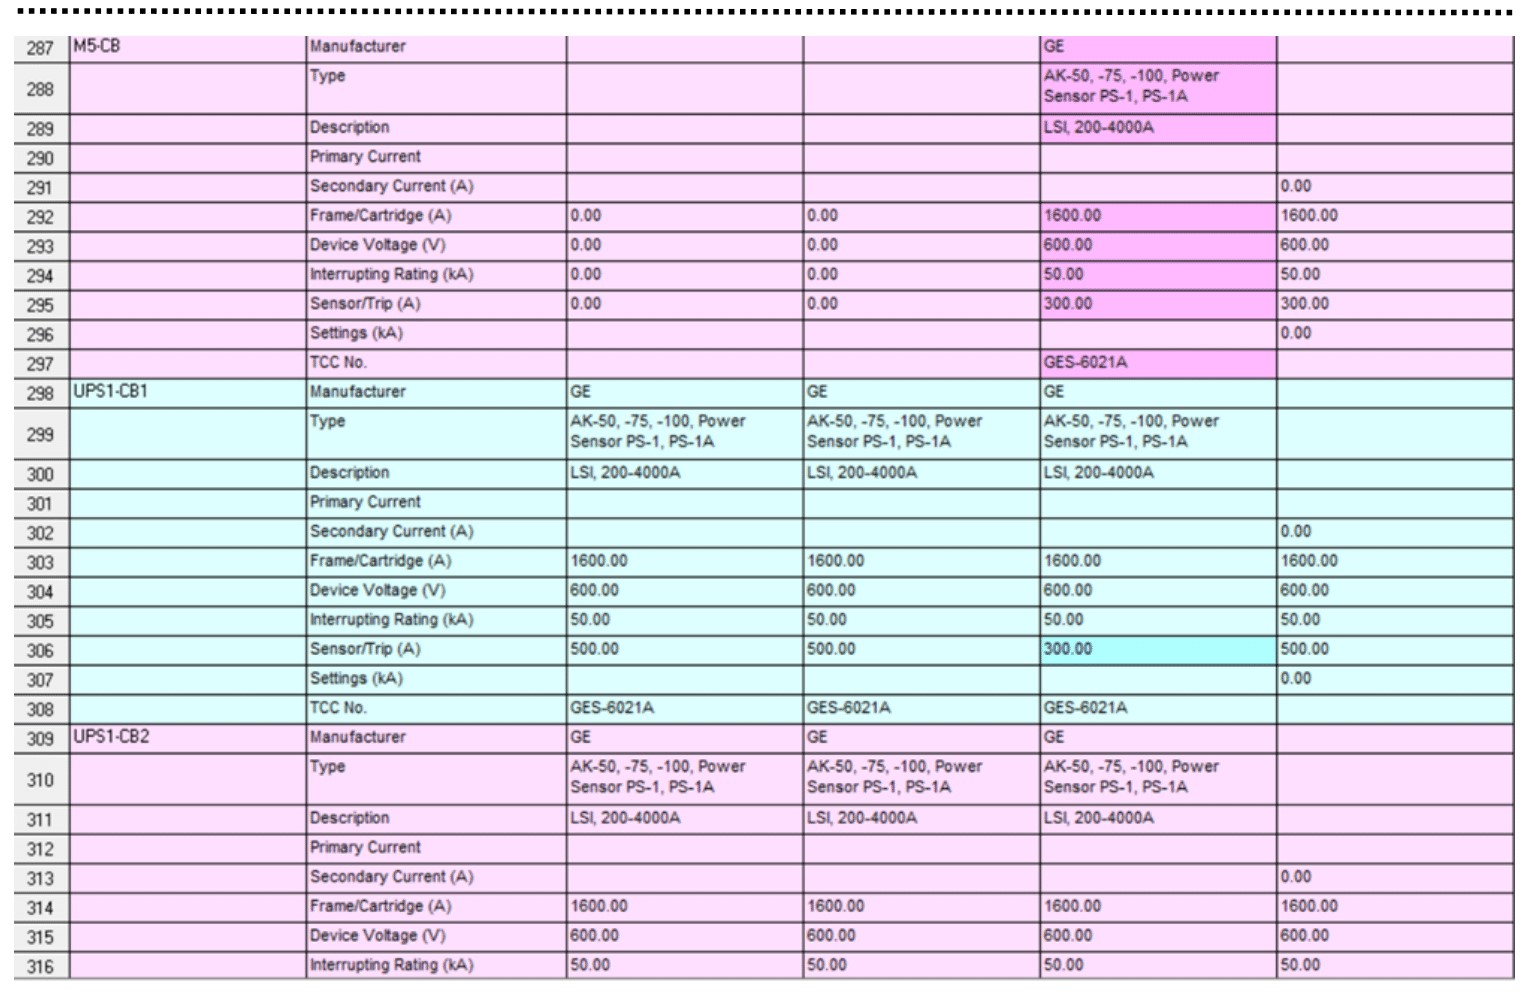
A summary of the model Input Data is shown in Figure 7 below:
Figure 7.1 Model Input Data (overview)
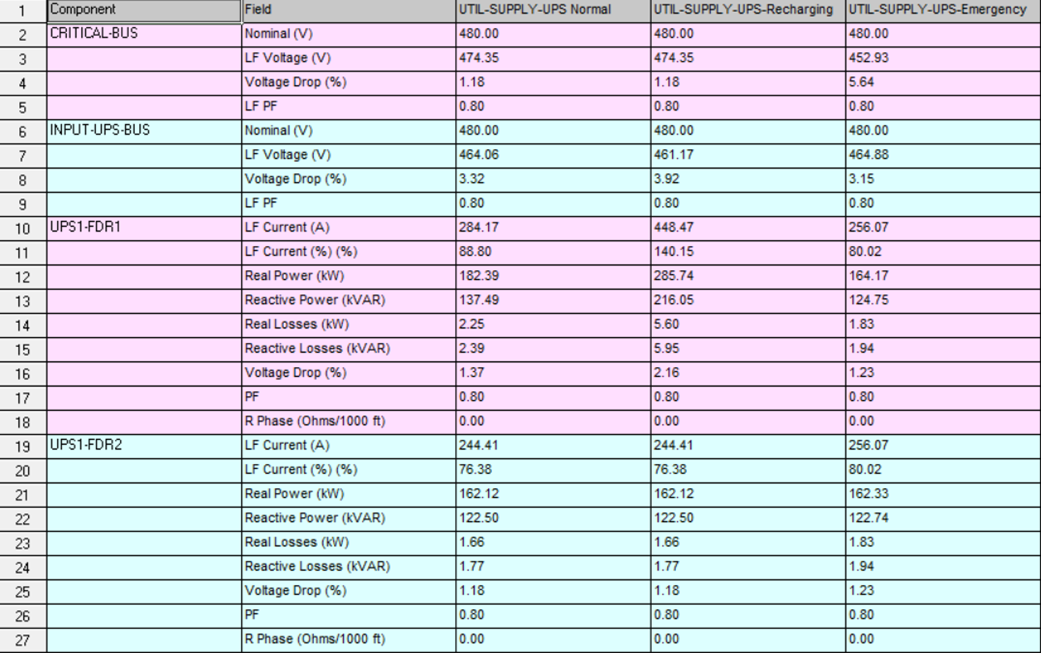
For example, the Power Flow Results for the model shown in Figure 1, the Scenario Utility supply, and the Generator supply for each mode of operation are provided in Figure 7.2 below. The Critical Load is supplied from the UPS unit only briefly. The power flow results are listed on the one-line SKM model.
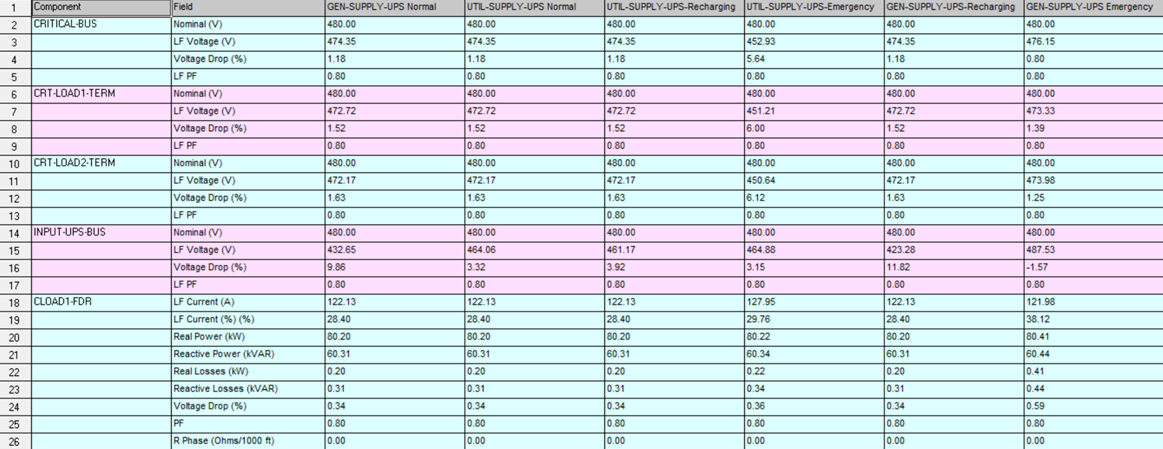
Comparative power flow results, Scenario UTIL-Supply, showing the results for each UPS mode of operation. For this example, during UPS recharging mode, the UPS1-FDR1 is heavily overloaded (140.15%0). Consequently, the size of this feeder would need to be increased.
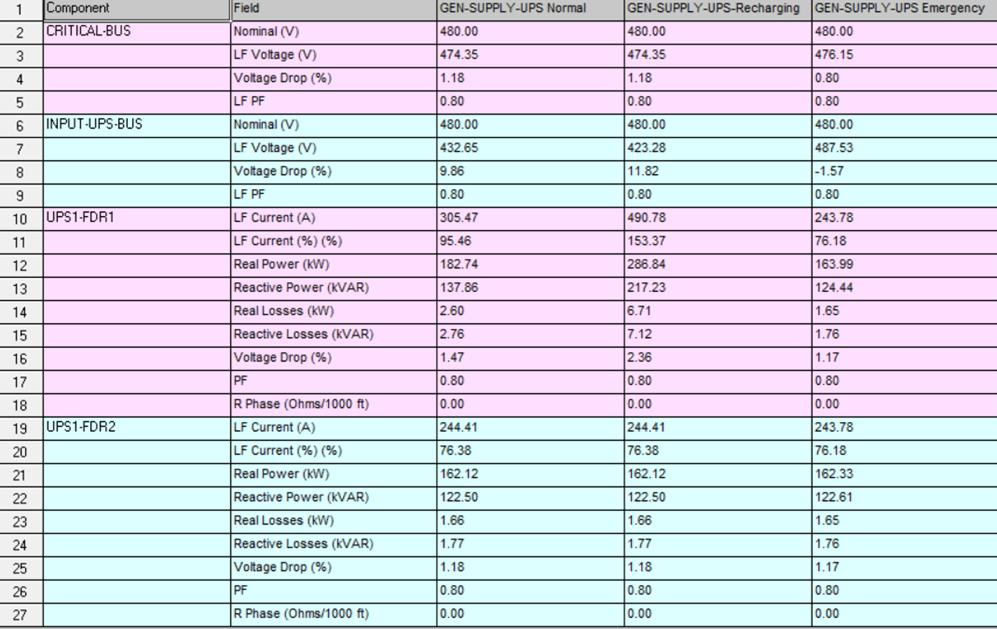
Comparative power flow results, Scenario GEN-Supply, showing the results for each UPS mode of operation. For this example, during UPS recharging mode, the UPS1-FDR1 is heavily overloaded (140.15%0). Consequently, the size of this feeder would need to be increased.
UPS Overloads and Support Time
For UPSs, the levels and ranges of overloads and support time are [2]:
103% overload 10 minutes to continuous;
125% overload between 30 sec and 10 minutes;
150% overload between 10 sec and 60 sec;
200% overload 10 to 20 cycles (current limit).
Notes: Since the above UPS specifications contain many possible overload and support times, designers must determine if a longer overload time limit provides valuable protection for the critical load [1]. Data Centers with redundant UPS systems features have a significant UPS over-capacity.
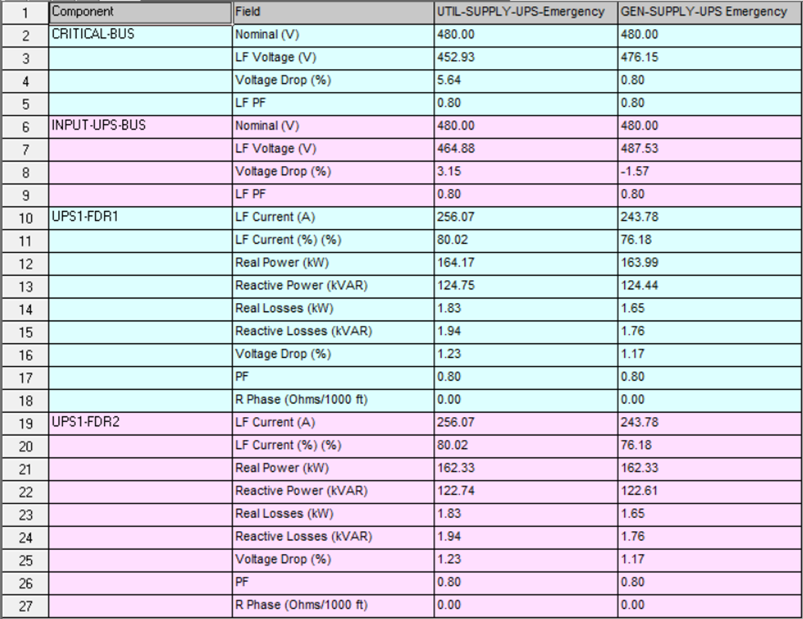
The “Power Flow Results” while the UPS unit is in emergency mode are listed below, Figure 7.3. The Fast Transfer Switch (FTS) bypasses the UPS unit, and the current flow on the upper and lower side is the same.

7.4 Short Circuit Analysis:
Short Circuit Analysis is one of the major tasks related to analyzing and planning electric power systems. The scope of a Short Circuit Analysis is as follows:
• Verify the circuit current path against short-circuit current stress (electrical, mechanical, and thermal);
• Evaluate and verify the interrupting capacity of existing switching devices;
• Calculate and set up adequate system protective device settings;
• Evaluate the system-wide post-fault voltage profile during a fault at a particular point;
• Improve the system layout design to minimize the effect of system faults.
Short Circuit Current at CRT-LOAD1-TERM (critical LOAD 1 terminal bus) is presented in Figure 7.7: the Scenario Normal; UPS Bypass Operation Mode.
In the bypass mode, the UPS units are protected against the faults. The Fast Transfer Switch (FTS) moves the UPS unit into bypass mode in less than 0.2 seconds. The short branch circuit current is listed in the figure capture listed below, Figure 7:

Note: The fast transfer switch (FTS) bypasses the UPS in less than 0.2 seconds and consequently protects the UPS unit. It is represented by the bypass function on page 2 of the SKM UPS editor.
7.5 Protective Device Coordination
Any electrical distribution system has only one purpose: to provide a continuous energy supply to utilize equipment at a reasonable cost. When a fault occurs in a system, it is necessary to clear the spot to provide safety to personnel, protect the circuit elements, and prevent unnecessary power outages. This feature is achieved by using appropriate and proper protections. We apply protective equipment such as lightning arresters, surge capacitors, reactors, and circuit interrupting devices to accomplish this protection function. Any protection project requires two steps
• The selection of the proper device to do the task;
• Select the correct settings for the devices so they will operate selectively with other devices to disconnect that portion of the system in trouble and with as little effect on the rest of the system as possible.
A power system protection project requires not only proper device selection but also wants to achieve the best coordination possible with the equipment we decided to buy. The statement “Coordination and Selectivity” are, in a sense, complementary terms and are used to describe the relative speeds at which two protective devices operate for the same fault current.
A power system protection project requires not only proper device selection but also wants to achieve the best coordination possible with the equipment we decided to buy. The statement “Coordination and Selectivity” are, in a sense, complementary terms and are used to describe the relative speeds at which two protective devices operate for the same fault current.
Coordination Studies:
A coordination study involves selecting and setting all the protective devices from the load upstream to the power supply. In selecting or developing these protective devices, a comparison is made of the operating times of all the devices in response to various levels of overcurrent. The objective, of course, is to design a selectively coordinated electrical power system.
Coordination procedure [1]:
The following procedure should be followed when conducting a coordination study:
• Start the coordination process from the bottom of the circuit and select a convenient voltage base. Usually, the lowest system voltage will be chosen. The Time-current graphical interface is automatically associated with the specified path;
• Specify protection points. These include the motor starting curve with the current and starting times, magnetizing inrush points, and the limits for specific protective paths the user selects. Do not select more than five protective devices for one protective course;
• Using the overlay principle, trace the curves for all protective devices on a composite graph, selecting ratings or settings that will provide overcurrent protection and ensure no overlapping of curves.
Notes [9]:
1. When coordinating IDMTL relays, the interval is usually 0.3-0.4 seconds; The interval consists of the following components: Circuit breaker opening 0.08 seconds (5 cycles). Relay over travel 0.10 seconds. Safety factor for CT saturation, settings errors, etc.: 0.22 seconds;
2. When coordinating relays with downstream fuses, the circuit opening time does not exist for the fuse, and the interval may be reduced accordingly; the time margin between the fuse total clearing curve and the up-stream relay curve could be as low as 0.1 seconds where clearing times below 1 second are involved;
3. When low-voltage circuit breakers equipped with direct-acting trip units are coordinated with relayed circuit breakers, the coordination time interval is usually regarded as 0.3 seconds;
4. When coordinating CBs equipped with direct-acting trip units, the characteristics curves should not overlap.
Generally, only a slight separation is planned between the different characteristic curves. If CBs are in series, the overlaps are accepted.
One starts by selecting the protective paths from the bottom part of the power system. A few PDC paths are presented in Figures 7.8, 7.9, and 7.10, while SKM professional software is employed.
UPS must transfer to bypass operation mode to provide enough fault-clearing current to trip the load circuit breaker in a load-side fault.
• Long duration inverter overload capability does not help – inverter does not have sufficient fault current to clear the fault;
• Trying to sustain a fault on the inverter (waiting for the O/L timer) will stress or damage the inverter and result in an output voltage drop;
• If bypass is unavailable – UPS will eventually trip off if the fault isn’t cleared, or the load will fail due to under voltage.
Additional considerations required to determine the robustness and suitability of a UPS system are:
• Maximum continuous temperature rating of UPS running at full load;
• Cooling system employed within UPS;
• Placement of fans for increased life and elimination of hot spots in the event of fan failure;
• Redundancy of fans and fan failure alarms;
• Proper handling of fault currents to reduce stress on UPS and loads.

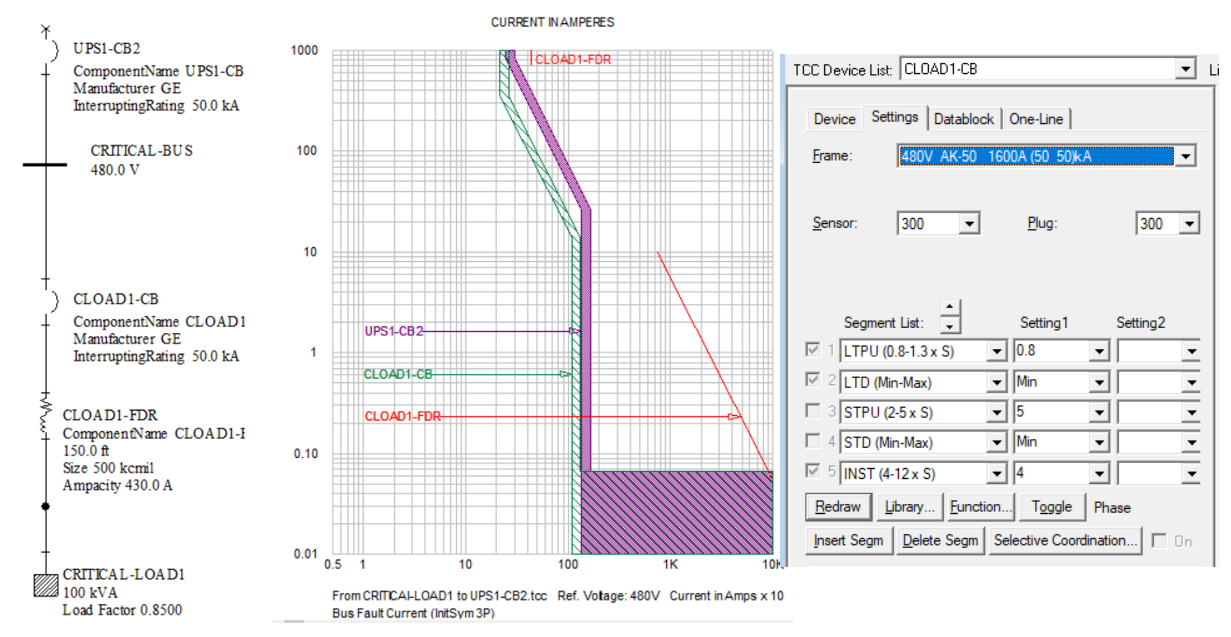
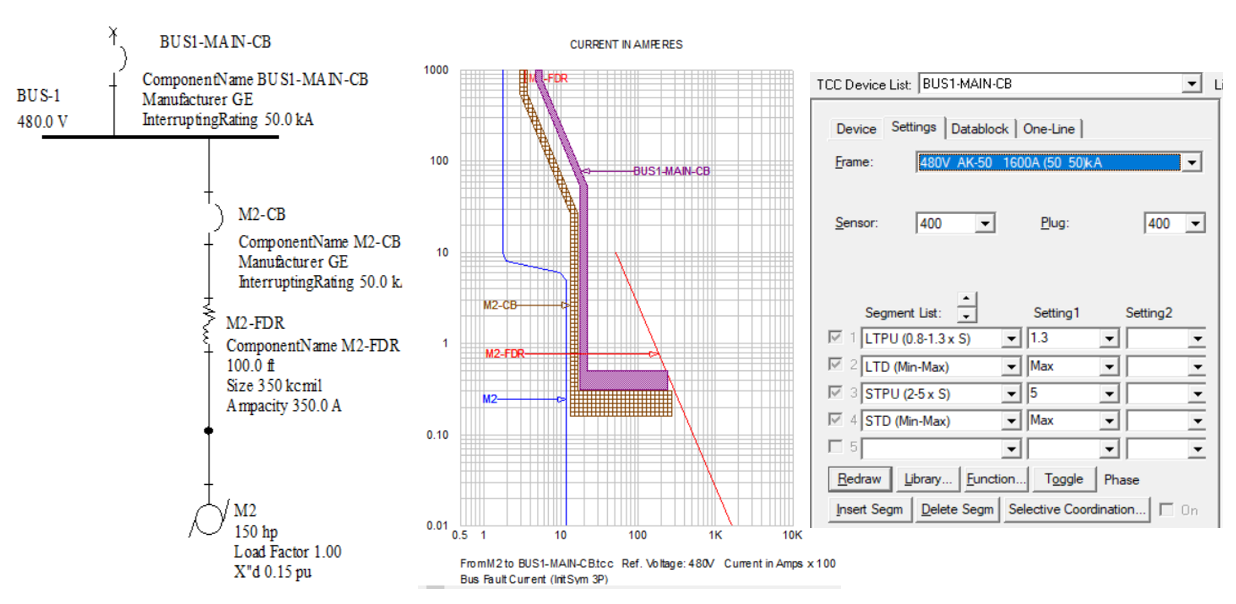
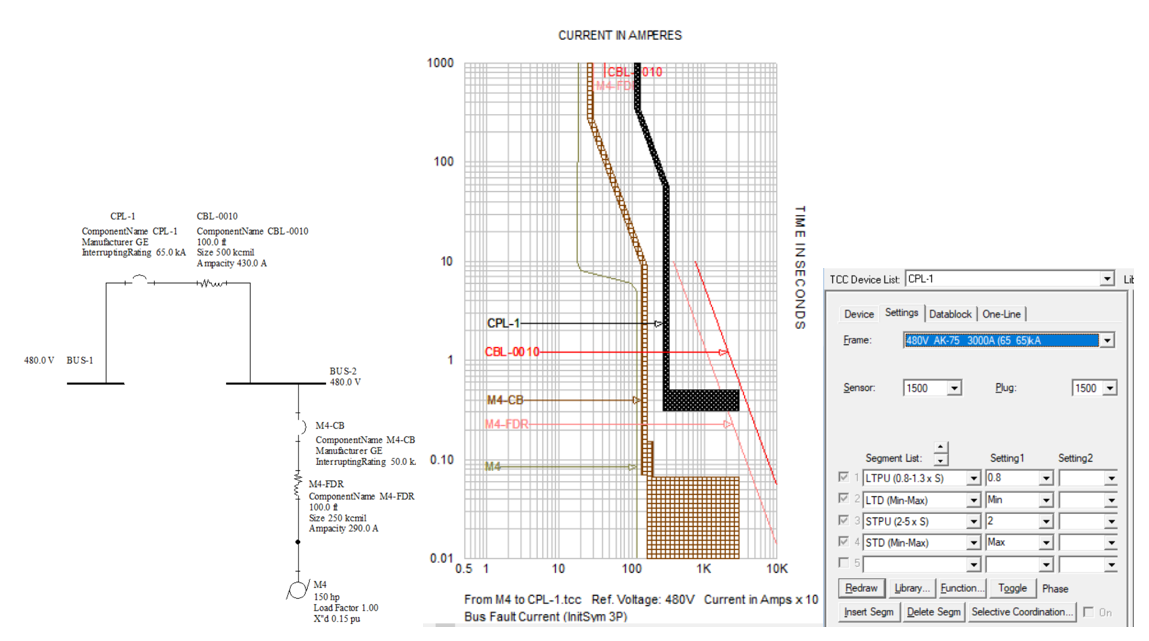
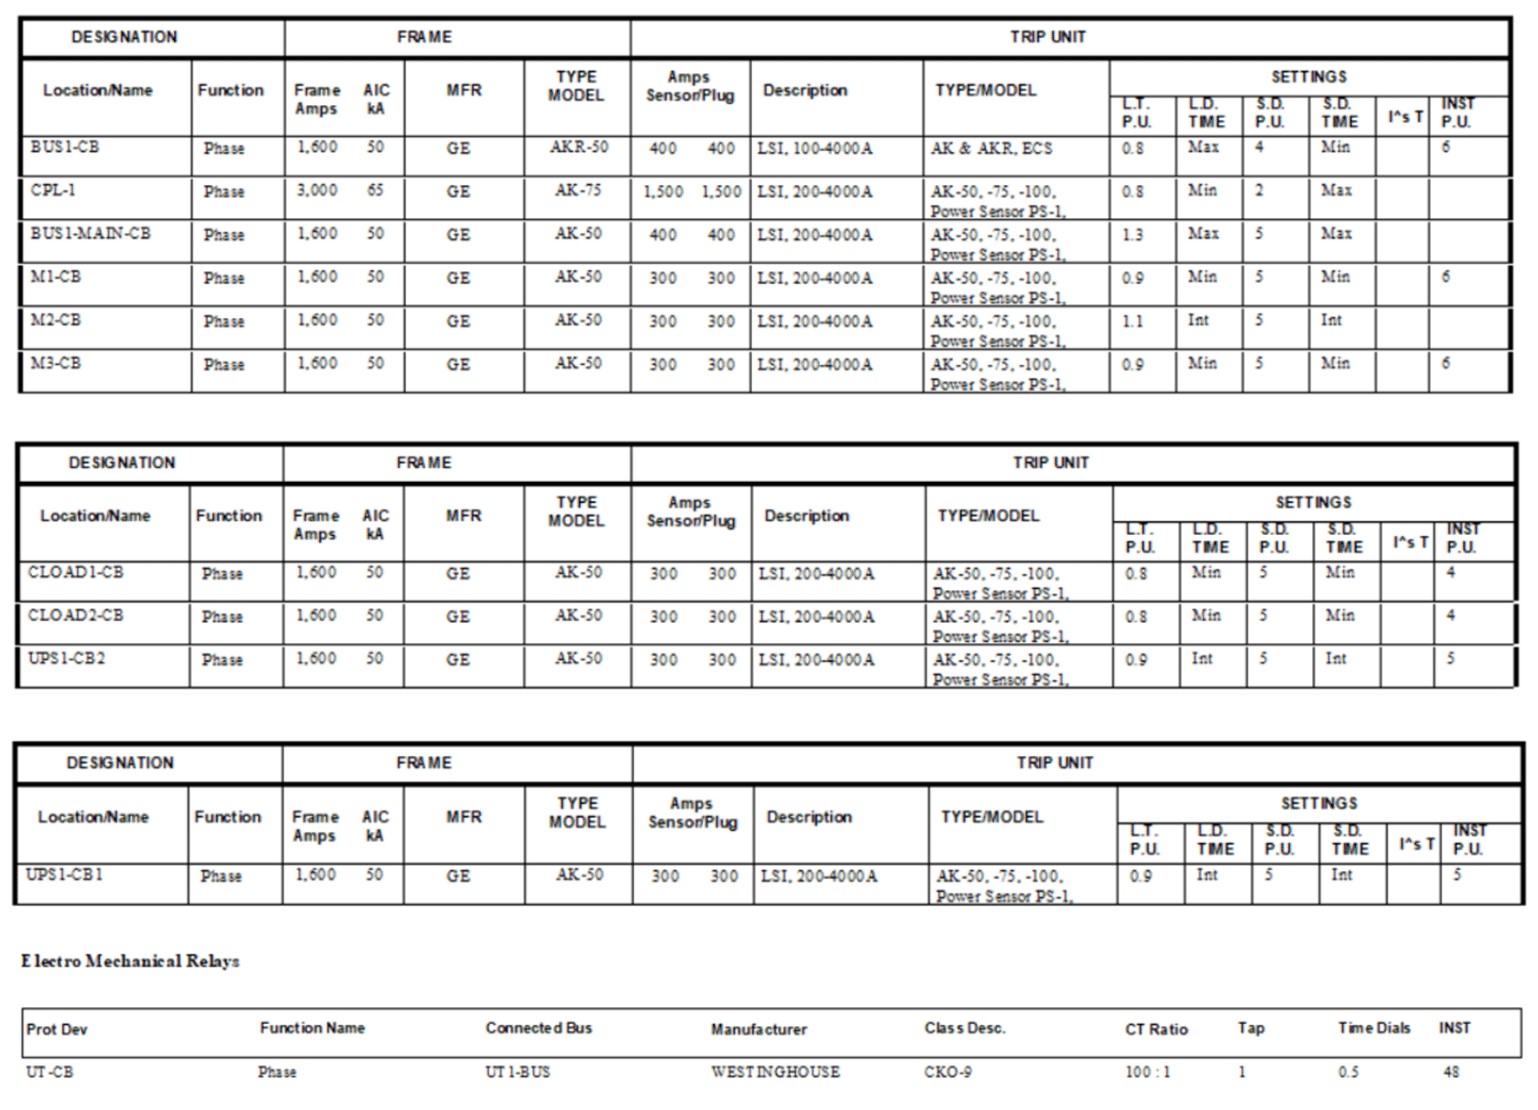
Table 7.1 – LV CBs Types, Frame, and Settings
8. Conclusions
The paper presents how to supply the critical electrical loads, the power system layout configuration, uninterruptible power supply (UPS) structure, modeling, and operation. The procedure for the power system studies Power Flow, Short Circuit, and Protective Devices Coordination using industrial, professional software – SKM is documented. Uninterruptible power supply (UPS) systems ensure continuous supply to critical loads and quality power. The UPS system design requires the proper technique, installation, and maintenance.
References
[1] Darie, S.: Modeling UPS for Critical Loads: Training Manuals (2005 to 2015), Power Analytics Corporation, San Diego, USA.
[2] SKM Power Software: UPS Units Modeling, 2016.
[3] CENELEC – EN 50091-1 Uninterruptible Power Supply. Part 1. General and Safety Requirements.
[4] IEC 62040-3 Uninterruptible Power Supply (UPS); Part 3. Method of Specifying the Performance and test requirements.
[5] ISO / IEC 9003,2018. Software Engineering Guidelines for applying ISO 9001, 2008 to Computer Software.
[6] IEEE Brown Book, IEEE Std. 399, 2015.
[7] IEEE Red Book, IEEE Std. 141, 2014.
[8] IEEE Std. 142-1991, “Recommended Practice for Grounding of Industrial and Commercial Power Systems” (IEEE Green Book).
[9] IEEE Std. 242-1986, “Recommended Practice for Protection and Coordination of Industrial and Commercial Power Systems” (IEEE Buff Book).
[10] IEEE Std. 1100-1992, “Recommended Practice for Powering and Grounding Sensitive Electronic Equipment” (IEEE Emerald Book).
[11] APS, Schneider Electric: Selection of the UPS Configuration, APS Schneider Electric, 2012.
Kevin McCarthy, Victor Avelar: Comparing UPS System Design Configuration. White Paper 75, Revision 3, Schneider Electric, 2016.
[12] Piller Power Systems: Isolated-Parallel UPS Configuration.
[13] Powerware 9315 (200 to 500 kVA) Static Uninterruptible Power Supply, Guide; Specification Models 225, 250, 300.
[14] 400 500 kVA, Power Ware 2003;
[15] IEC 62040-1, 2008. TEST REPORT Uninterruptible Power Systems (UPS) – Part 1: General and Safety requirements for UPS.

Author: Prof. Silviu Darie, PhD (EE), Technical University Cluj Napoca, Honorary Member of Romanian Technical Sciences Academy, Former VP Power Analytics Corporation, USA.
Prof. Dr. Daries has more than 20 years’ work experience with Power Analytics products, and nearly 40 years of university-level electrical engineering instruction and industry consultancy in power system analysis computer applications, electrical power quality, transmission pricing, embedded generation, computer aided power system analysis and design. In addition to earning both his doctorate and master’s degrees in electrical engineering, he has authored or co-authored hundreds of technical books, student manuals, technical papers, and research projects.
Dr. Darie is a former professor of power systems and electrical engineering in Technical University of Cluj Napoca, Romania, and University of Cape Town, South Africa, as well as a former visiting professor in École polytechnique fédérale de Lausanne, Switzerland. He has received several awards and recognitions throughout his years of expertise including the Award Professor for Life of Faculty of Engineering, University of Cape Town 1993, Romanian National Research Award. Since 2005 he is the Vice President of Consulting and Engineering for Power Analytics Corporation.
Dr. Darie led nearly 180 electrical power projects worldwide; he constructed 18 prototypes designed for mass production, holds three patents, and is experienced in most leading software programs for electrical engineering. He has provided services to clients worldwide, and is a registered professional engineer in Romania, South Africa, and New Zealand.
Contact address:
Prof. Silviu Darie, Ph.D., P.E.,
Romania: Bd. 21 Decembrie 1989, No. 104 Bl. L1, Sc. 1, Ap. 8 Cluj Napoca, 400124 Romania
Mobile: +40728312222
Email: silviu.darie@gmail.com, Silviu.darie@enm.utcluj.ro
