Published by Grzegorz MASŁOWSKI, Robert ZIEMBA, Tomasz KOSSOWSKI,
Rzeszow University of Technology
Abstract. The results of simulations of overvoltages induced in the overhead transmission line, caused by nearby lightning stroke are presented. Calculations were made using the LIOV module implemented in the EMTP-RV program. The influence of the distance of the lightning channel from the line to the overvoltages has been investigated. The results for the various lightning currents in the lightning channel have been compared.
Streszczenie. Przedstawiono wyniki symulacji przepięć indukowanych w linii napowietrznej od pobliskich wyładowań atmosferycznych. Obliczenia wykonano przy użyciu modułu LIOV zaimplementowanego w programie EMTP-RV. Zbadano wpływ odległości kanału pioruna od linii oraz wpływ kształtu prądu piorunowego na kształt i wartości szczytowe indukowanych przepięć. (Przepięcia w liniach napowietrznych wywołane pobliskim wyładowaniem atmosferycznym).
Keywords: lightning protection, lightning induced overvoltages, overhead power line.
Słowa kluczowe: ochrona odgromowa, indukowane przepięcia piorunowe, napowietrzna linia energetyczna.
Introduction
Lightning-induced overvoltages are transient overvoltages on overhead power lines caused by indirect lightning events, i.e. lightning strikes hitting the ground or objects in the vicinity of the lines. In accordance with lightning protection standards IEC 62305 [1-3], the impact of nearby lightning strikes shall be taken into account in the design of the Lightning Protection System (LPS). Although the effects of nearby lightning strikes are smaller than direct impacts, the range of impact is much greater. They cause overvoltage in the indoor installations and in the lines coming into the building.
Computer code LIOV (Lightning Induced Overvoltages) [4-6] was implemented as the special module in EMTP-RV software. Now LIOV module allows for the calculation of lightning-induced voltages along a multiconductor overhead line as a function of:
– lightning current waveshape (peak value, front steepness, and duration), stroke location and return stroke velocity;
– line geometry (height, length, number and position of conductors) and line terminations;
– ground resistivity and relative permittivity.
The geometry for the calculation of LEMP (Lightning Electromagnetic Pulse) and its coupling with an overhead line, implemented in LIOV module is showed in Fig. 1.

LIOV code adopts an engineering return stroke model and the lightning channel is assumed as a straight vertical antenna [7]. An engineering return stroke model is a formula that describes the spatial and temporal distribution of the return stroke current along the lightning channel, as a function of the current waveshape at the base of the channel and one or two additional parameters. This model with the straight and perpendicular lightning channel was simulated in [8-10] with the MTLL and the MTLE return stroke models in frequency domain.
In the present version of LIOV-EMTP module only the Transmission Line (TL) return stroke model is adopted [11, 12].
Modelling and simulation of lightning induced overvoltages
The most commonly adopted return-stroke models to calculate lightning-induced voltages are [10]: the Modified Transmission Line Linear (MTLL) model; the Modified Transmission Line Exponential (MTLE) model; and the Transmission Line (TL) model. In the MTLL model the current wave propagates without distortion but its peak value decays linearly with height.
In the MTLE model the current wave propagates similarly but the current peak value decays exponentially with height.
In the TL model, it is assumed that the current wave at the base channel propagates up the lightning channel without distortion and without attenuation, at a constant speed v. The return stroke current in the lightning channel at height z is:
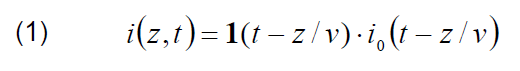
where: 1(t) is the Heaviside function equal to 1 for t ≥ z/v and zero otherwise; v is the upward propagating return stroke velocity; i0(t) is the current at the base of the channel.
The return stroke velocity is expected to be between 100 and 200 m/μs [13]. The channel base current waveform can be represented by means of Heidler function, which is a function of the lightning current for analysis purposes in IEC 62305-1 standard, specified by equation:

In (2) I is the peak current, k is the correction factor for the peak current, τ1 is the front time constant and τ2 is the tail time constant.
According to IEC 62305-1 [1], the current shapes of the first positive impulse 10/350 µs, the first negative impulse 1/200 µs and the subsequent negative impulses 0.25/100 µs, defined by Heidler function, were taken for calculation. The peak values for the first lightning protection level (LPL) were chosen (respectively 200 kA, 100 kA and 50 kA). Comparison of waveshape of the lightning current components is shown in Fig. 2.


In lightning protection standard [2] there are defined the collection areas of flashes directly to line (Al) and to ground near line (AL). This collection areas are taking into account for calculation of the risks of lightning losses. The width of these areas are different in two subsequent editions of IEC 62305-2 standard. The width of collection area of flashes into the line was increased from WI = 30 m to WI = 40 m and the width of the collection area of indirect lightning flashes was increased from WI = 1000 m to WI = 4000 m. As we can see, in the case of indirect discharges, the collection area has been increased four times. This increase of the collection area can be of importance in assessing the risk of the lightning damage in the design of the LPS.
The example of a system that can be simulated with LIOV-EMTP module is shown in Fig. 4. This case study was simulated by using the circuit shown in Fig. 5. The overhead three-wire transmission line of 1000 m in length and 10 m in height was taken to the simulations. Position of the lightning channel is xs = 500 m and ys (distance of the lightning channel from power line is variable: ys1 = 100 m, ys2 = 500 m, ys3 = 2000 m).
The geometrical data of the conductors of the overhead line are represented in Fig.6, where the subscripts of H, D and d refer to the pins corresponding to the line ends.


The ends of the transmission line are terminated by “line match” components containing connected to ground characteristic impedances of the line.
Results of the simulation
In Fig. 7 and Fig. 8 are shown the induced overvoltages at the ends of transmission lines, for different lightning current impulses and for different soil parameters. In Fig. 7 are shown results of simulations for case study with lossy ground (soil resistivity: ρ = 100 Ωm). Strike distance ys is variable: 100 m, 500 m and 2000 m. Simulations has been conducted for the first positive impulse 10/350 μs with peak value 200 kA; the first negative impulse 1/200 μs with peak value 100 kA; and for the subsequent negative impulse 0.25/100 μs with peak value I = 50 kA. In Fig. 8 are shown results of simulations for case study with lossless ground, and for soil with resistivity ρ = 100 Ωm and ρ = 500 Ωm. Strike distance ys = 500 m. Simulations has been conducted for the first positive impulse 10/350 μs with peak value I = 200 kA; the first negative impulse 1/200 μs with peak value I = 100 kA; and for the subsequent negative impulses 0.25/100 μs with peak value I = 50 kA.

Fig. 7. Comparison of the induced overvoltages for case study with lossy ground (soil resistivity: ρ = 100 Ωm). Strike distance ys is variable: 100 m, 500 m and 2000 m: a) the first positive impulse 10/350 μs, peak value 200 kA; b) the first negative impulse 1/200 μs, peak value 150 kA; c) the subsequent negative impulses 0.25/100 μs, peak value 100 kA.

Fig. 8. Comparison of the induced overvoltages for case study with lossless ground and for soil resistivity ρ = 100 Ωm and ρ = 500 Ωm. Strike distans ys = 500 m. a) the first positive impulse 10/350 μs, peak value 200 kA; b) the first negative impulse 1/200 μs, peak value 100 kA; c) the subsequent negative impulses 0.25/100 μs, peak value 50 kA.
To compare voltage distribution along the line in Fig. 9 were shown overvoltages in the middle (xs = 500 m) and at the end of the line (xs = 0 m) for different distance of the lightning channel from the line. Simulation was for the first positive impulse 10/350 μs with amplitude 200 kA.

Fig. 9. Comparison of the induced overvoltages in the middle and at the end of the line for first lightning stroke 10/350 200 kA, for different distance of the lightning channel from the line: a) ys = 100 m, b) ys = 500 m, c) ys = 2000 m
Conclusions
The paper presents results of the computer simulations of the overvoltages induced in the transmission line by nearby lightning stroke. Influence of the striking distance, soil resistivity and shape of the lightning current were investigated. As shown in Fig. 7 maximum values of induced overvoltages strongly depend on the distance of the lightning channel from the line. Results in Fig. 8 shows that soil resistivity does not have a significant impact on maximum values and shapes of induced overvoltages within the considered distances. As shown in Fig. 9, the peak values of the induced voltages at the centre of the line relative to the overvoltages on the ends of the line depend on the distance of the lightning channel from the line.
REFERENCES
[1] IEC 62305-1:2010 Protection against lightning – Part 1: General principles.
[2] IEC 62305-2:2010 Protection against lightning – Part 2: Risk management.
[3] NFPA 780 Standard for the Installation of Lightning Protection Systems. 2014.
[4] C. A. Nucci and F. Rachidi, “Interaction of electromagnetic fields with electrical networks generated by lightning,” in The Lightning Flash: Physical and Engineering Aspects, V. Cooray, Ed. IEE – Power and Energy Series 34, 2003, pp. 425–478.
[5] F. Napolitano, A. Borghetti, C. A. Nucci, M. Paolone, F. Rachidi, and J. Mahserejian, “An advanced interface between the LIOV code and the EMTP-RV,” presented at the 29th Int. Conf. Lightning Protection (ICLP), Uppsala, Sweden, 2008
[6] M. Paolone, F. Rachidi, A. Borghetti, C. A. Nucci, M. Rubinstein, V. A. Rakov, and M. A. Uman, “Lightning
electromagnetic field coupling to overhead lines: theory, numerical simulations, and experimental validation”, IEEE Trans. Electromagn. Compat., vol. 51, no. 3, pp. 532–547, 2009
[7] Masłowski G., Rakov V.A.: New Insights Into Lightning Return-Stroke Models with Specified Longitudinal Current Distribution. IEEE Trans. Electromagn. Compat., Vol. 51, No. 3, August 2009, 471–478
[8] Masłowski G. Ziemba R.: Calculation of lightning-induced voltages inside the structure using engineering return-stroke models. Proc. 28th International Conference on Lightning Protection, Kanazawa, Japan, 2006, 1132-1137
[9] Masłowski G., Ziemba R.: Modelowanie przepięć atmosferycznych w liniach elektroenergetycznych z uwzględnieniem kanału pioruna. Przegląd Elektrotechniczny, 3/2007, 153–156.
[10] Masłowski G.: Współczesne trendy w modelowaniu wyładowań atmosferycznych – teoria i zastosowania, Przegląd Elektrotechniczny (Electrical Review), R. 86 NR 11a/2010, 308–312
[11] M. A. Uman and D. K. Mclain, “Magnetic field of lightning return stroke,” J. Geophys. Res., vol. 74, no.28, pp. 6899–6910, 1969.
[12] F. Napolitano, “An analytical formulation of the electromagnetic field generated by lightning return strokes,” IEEE Trans. Electromagn. Compat., vol. 53, no. 1, pp. 108–113, 2011.
[13] V. A. Rakov and M. A. Uman, Lightning: Physics and Effects. Cambridge, 2003.
Authors dr hab. inż. Grzegorz Masłowski, Politechnika Rzeszowska, Wydział Elektrotechniki i Podstaw Informatyki, ul. Powstańców Warszawy 12, 35-959 Rzeszów, e-mail: maslowski@prz.edu.pl; dr inż. Robert Ziemba, Politechnika Rzeszowska, Wydział Elektrotechniki i Podstaw Informatyki, ul. Powstańców Warszawy 12, 35-959 Rzeszów, e-mail: maslowski@prz.edu.pl; mgr inż. Tomasz Kossowski, Politechnika Rzeszowska, Wydział Elektrotechniki i Podstaw Informatyki, ul. Powstańców Warszawy 12, 35-959 Rzeszów, e-mail: t.kossowski@prz.edu.pl;.
Source & Publisher Item Identifier: PRZEGLĄD ELEKTROTECHNICZNY, ISSN 0033-2097, R. 94 NR 2/2018. doi:10.15199/48.2018.02.10
